Power-Building Opportunity Index (2022)
Overview
The Power-Building Opportunity Index is the result of collaboration between Catalyst California and the Integrated Voter Engagement Redistricting Alliance and the People’s Bloc, two coalitions of community-based organizations at the state and Los Angeles County levels. The index is a composite of data-driven indicators selected by our coalition partners, including demographic, community, and power-building data. These data aim to identify opportunities to build an engaged political base that prioritizes and unifies the voices of low-income residents and people of color. The Index helps to identify regions in the state with shared experiences and living conditions that have the potential to drive progressive policies and more equitable outcomes.
These indicators can be used to support:
- Identification of regions likely to benefit from progressive democracy reforms
- Targeting integrated voter engagement efforts
- Prioritization of funding and capacity building resources
Brief Methodology
To calculate the Power-Building Opportunity Index (2022), we first standardize values for all indicators using z-scores. Z-scores measure how far values are from the mean or average of a population, in this case how far each census tract’s estimates fall from the average for all census tracts in California. This is one way we can estimate areas with higher or lower need. For indicators with data by race, we then calculate a composite score which is the average standardized value (z-score) of all rates by race available. We do not include rates for non-Latinx White in order to prioritize and identify opportunities for building power among communities of color. For indicators where a higher score indicates lower need, e.g. post-secondary education and eligible voter turnout, we reverse the sign of the values (from positive to negative) so that all indicators are on the same scale from lower to higher need. Many times we are dealing with estimates of true values, so we cap any z-scores above or below a threshold and screen out indicators with unreliable estimates.¹
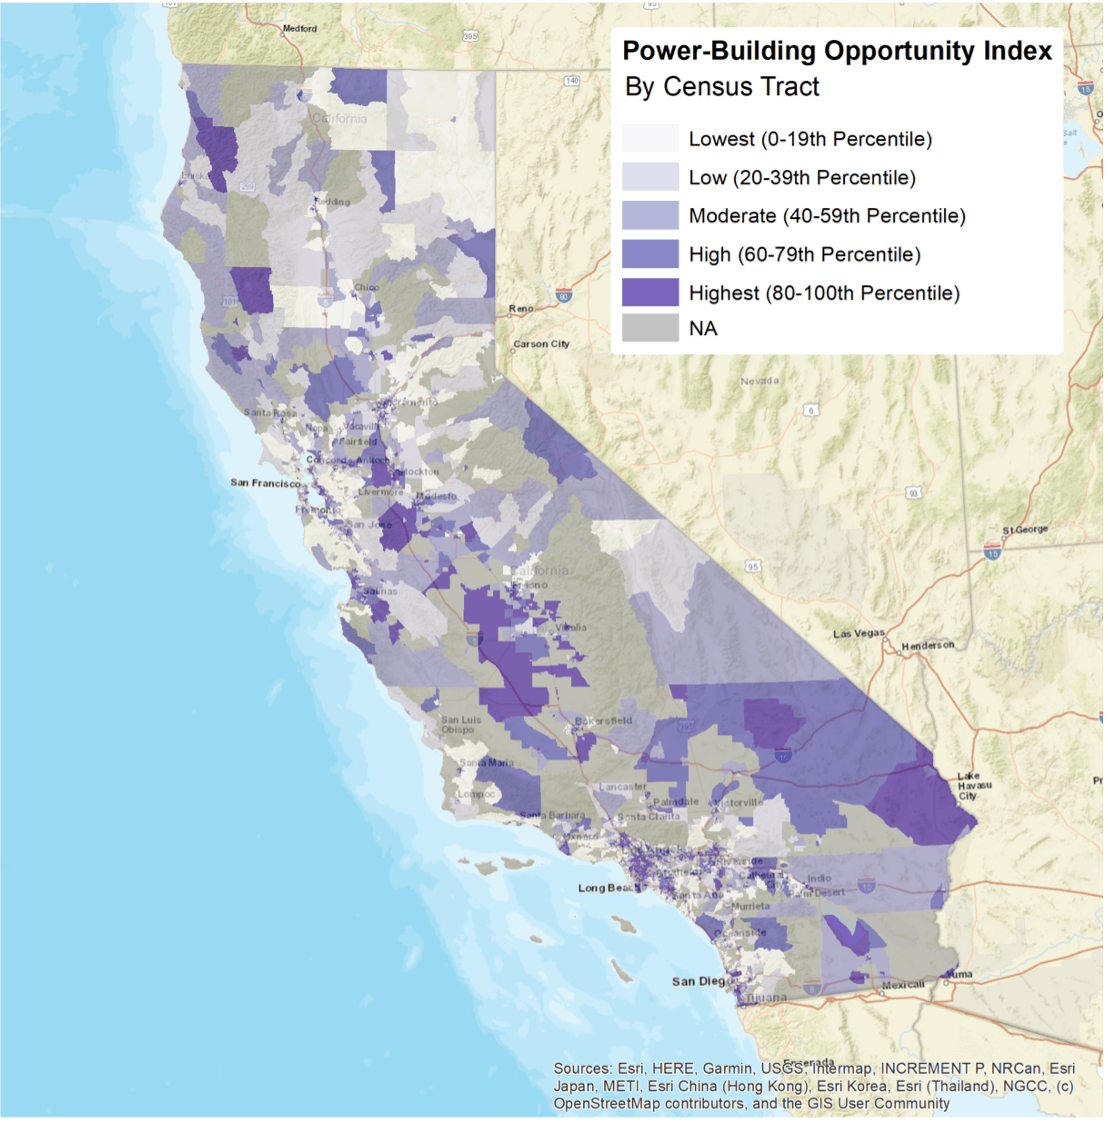
We then calculate the overall index score as the sum of indicator and composite values divided by the number of values a given census tract has. Finally, we convert the index score into a percentile, ranging from 0 to 100. A higher percentile means more opportunity, while a lower percentile means less opportunity. The percentiles are grouped into 5 equal categories and assigned labels from Lowest to Highest Opportunity. Census tracts with six or fewer data values do not receive a score.
Indicators included in Index:
- Composite: Population by Race/Ethnicity
- Includes American Indian / Alaska Native, Native Hawaiian / Pacific Islander, Asian, Black, Latinx, Other Race, Two or More Races.² - Composite: Citizen Voting Age Population by Race/Ethnicity
- Includes American Indian / Alaska Native, Native Hawaiian / Pacific Islander, Asian, Black, Latinx, Two or More Races. All groups exclude Latinx, except Latinx.³ - Composite: Immigrant Population by Race/Ethnicity
- Includes American Indian / Alaska Native, Native Hawaiian / Pacific Islander, Asian, Black, Latinx, Other Race, Two or More Races. All groups exclude Latinx, except Latinx. - Composite: Limited English-Speaking Population (LEP) by Race/Ethnicity
- Includes American Indian / Alaska Native, Native Hawaiian / Pacific Islander, Asian, Black, Latinx, Other Race, Two or More Races. All groups exclude Latinx, except Latinx. - Composite: Population with a Disability by Race/Ethnicity
- Includes American Indian / Alaska Native, Native Hawaiian / Pacific Islander, Asian, Black, Latinx, Other Race, Two or More Races. All groups exclude Latinx, except Latinx. - People with Post-Secondary Education
- Population Below 200% of Federal Poverty Level
- Housing Cost-Burdened Population (30% or more of income spent on housing)
- Migrant Student Population
- Pollution Burden
- Eligible Voter Turnout
- Voters Supporting Proposition 15
Limitations
Data screening can result in data for census tracts with smaller populations and/or groups with smaller populations being suppressed. Many rural areas with few residents do not have index scores. Due to smaller population sizes, groups like American Indian / Alaska Natives and Native Hawaiian / Pacific Islanders have fewer reliable estimates than larger groups.
The Index also does not account for existing coalitions and civic engagement efforts that could be used even more to build powerful bases of low-income people and people of color. The Index should be paired with on-the-ground knowledge to further identify areas for power-building opportunities based on the existing community and political landscape.
Power-Building Opportunity Index Map
- We cap z-scores above 3.5 or below -3.5. We screen out indicators with coefficients of variation above 40%.
- American Indian / Alaska Native and Native Hawaiian / Pacific Islander include Latinx and non-Latinx, and people of these races alone and in combination with another race. Asian, Black, Other Race are one race alone and exclude Latinx. Two or More Races excludes Latinx.
- American Indian / Alaska Native and Native Hawaiian / Pacific Islander include people of these races alone and in combination with another race.
Contributors
- Leila Forouzan, Manager of Research & Data Analysis
- Alexandra Baker, Research & Data Analyst
- David Segovia, Research & Data Analyst
- Chris Ringewald, Senior Director of Research & Data Analysis
- Maria Khan, Research & Data Analyst
- People's Health Solutions
Reviewer
Elycia Mulholland Graves, Director of Research & Data Analysis
Data Sources
Population Data
U.S. Census Bureau, 2016-20, American Community Survey, 5-Year Estimates, Table DP05. Retrieved from https://data.census.gov/cedsci/.
Citizen Voting Age Population (CVAP)
U.S. Census Bureau, 2016-20, American Community Survey, 5-Year Estimates. Retrieved from https://www.census.gov/programs-surveys/decennial-census/about/voting-rights/cvap.html.
Post-Secondary Education
U.S. Census Bureau, 2016-20, American Community Survey, 5-Year Estimates, Table B15003. Retrieved from https://data.census.gov/cedsci/.
Immigrant Population
U.S. Census Bureau, 2016-20, American Community Survey, 5-Year Estimates, Table B05003. Retrieved from https://data.census.gov/cedsci/.
Limited English-Speaking Population (LEP)
U.S. Census Bureau, 2016-20, American Community Survey, 5-Year Estimates, Table C16001. Retrieved from https://data.census.gov/cedsci/.
Population Below 200% Federal Poverty Level
U.S. Census Bureau, 2016-20, American Community Survey, 5-Year Estimates, Table S1701. Retrieved from https://data.census.gov/cedsci/.
Population with a Disability
U.S. Census Bureau, 2016-20, American Community Survey, 5-Year Estimates, Table S1810. Retrieved from https://data.census.gov/cedsci/.
Housing Cost-Burdened Population (30% or more of income spent on housing)
U.S. Census Bureau, 2016-20, American Community Survey, 5-Year Estimates, Table B25106. Retrieved from https://data.census.gov/cedsci/.
Migrant Student Population
California Department of Education, 2021-22, California Longitudinal Pupil Achievement Data (CalPADS). Retrieved from https://www.cde.ca.gov/ds/ad/filescupc.asp.
Pollution Burden
California Office of Environmental Health Hazard Assessment, CalEnviroScreen 4.0. Retrieved from https://oehha.ca.gov/calenviroscreen/report/calenviroscreen-40.
Eligible Voter Turnout
Statewide Database 2020 and CVAP 2015-19 5-Year Estimates. Retrieved from https://statewidedatabase.org/.
Proposition 15 Results
Statewide Database 2020. Retrieved from https://statewidedatabase.org/.
Census Tract and City Boundaries
U.S. Census Bureau, 2020 Cartographic Boundary Files. Retrieved from https://www.census.gov/geographies/mapping-files/time-series/geo/cartographic-boundary.2020.html.
Los Angeles County Supervisorial District Boundaries
Los Angeles County, 2021. Retrieved from https://redistricting.lacounty.gov/final_map_and_submissions/.
Statewide Legislative District Boundaries
2020 California Citizens Redistricting Commission, 2021. Retrieved from https://www.wedrawthelinesca.org/final_maps/.